Sales Activity
This report monitors the performance of your sales managers by their success in winning contracts, number of appointments, and other criteria. Data are sorted into transparent graphs and it is a helpful tool for evaluation, distribution of bonuses, etc.
Calculation Requirements
The requirements for viewing the values of this report are:
- The sales manager is registered as the deal owner. Evaluation of his success rate is related to the predefined workflow in the Deals module. The report also works with Deal Origin and Price (Default Currency) in the Deal main list.
- The user who is generating the report has sufficient permissions to view the deals and journals of other users.
- Sales managers use journals to record their activities and differentiate the types of activities.
Report Parameters

| Parameter | Description |
|---|---|
| Start | Beginning of the period. |
| End | End of the period. |
| Sales Manager | Choose the user you want the report on. If you select the (All) value, you will generate statistics for all users. |
| Deal Type | Choose a specific type of deal or all deals by the (All) option. |
After changing values, the report will be automatically generated again.
Generated Report
Sales Funnel Chart
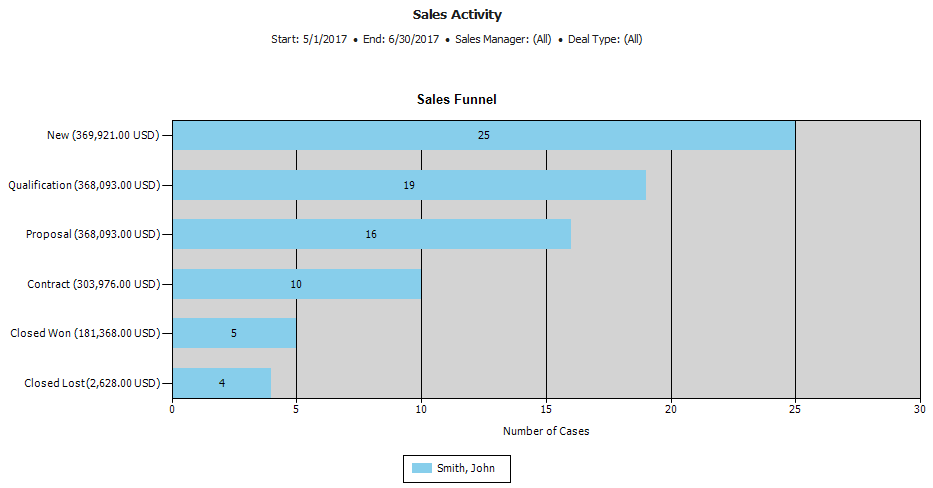
In the chart, you will find the names of workflow statuses listed on the Y-axis, each containing at least one of the user's deals that transitioned into that stage during the given period. The number in brackets is the sum of all deal prices that have this status (the sum is calculated from the Price (Default Currency) values in the Deal main list). The Default currency is possible to change by the Default Currency setting.
The X-axis shows numbers that represent the amount of deals. If the report is generated for only one user, the values will relate to this user. If the report is generated for all users, there will be the number of all deals and the users will be differentiated by color. There will be a legend below the chart.
Won Deals Chart
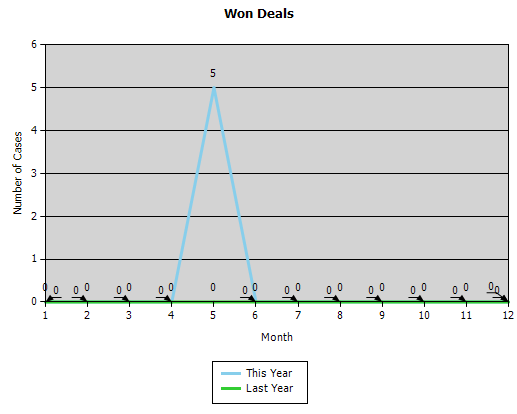
The graph shows the statistics of the deals amount that a user has converted to projects. Data are not limited by a selected period, but are calculated from all values in the current year and, for comparison, also in the previous year.
Origin of Won Deals Chart
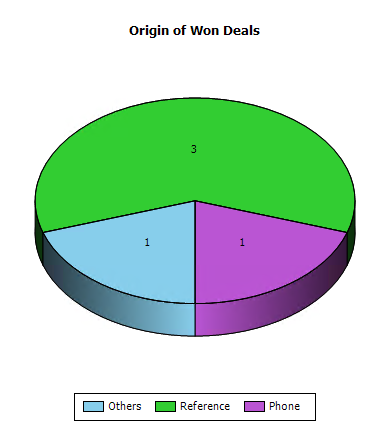
This pie chart compares the number of deals by their source of origin. The chart shows only those deals that were converted to the project. It is necessary to have the Deal origin field filled in the Deal window.
User Activity Table
The User activity table shows every activity of a user in a selected time period. The first column of the table is Activity Type (name of activity) and other columns contain weekly information about the number of performed activities of this type.
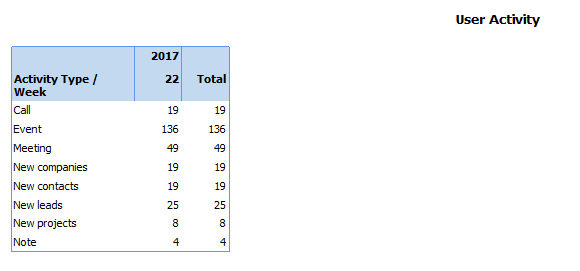
Rows calculate how many of these items were created by the user in a selected time period. The names of these rows can differ according to your settings for journal types in your eWay-CRM system.