Project Costs
Using this report, you can easily find out what the costs of your company are related to a specific project.
If you think that your team does not work efficiently enough you can search - with the help of this report - what can be improved and what should be paid attention to.
Calculation Requirements
The basic requirements are:
- Users fill in Estimated Revenue, Actual Revenue, and other price fields on projects.
- The user who generates the report has permission the view projects.
Report Parameters

| Parameter | Description |
|---|---|
| Project | Choose the project whose costs interest you. Projects are displayed in the list in this form: "Name of the company (customer) - Project name". |
| Perios | Select the month (values are in YYYY-MM format). If you select the (All) value, you generate statistics for all months. |
After selecting all the values, the report will automatically be generated. Each change in parameters generates a new report.
Generated Report
Table With Financial Information
The table in the top part of the report informs you about Project costs, Final price, and Profit from the selected project and you can also see the date of the project's end. You see the Project manager who is responsible for the project and how much time was spent on the project realization.
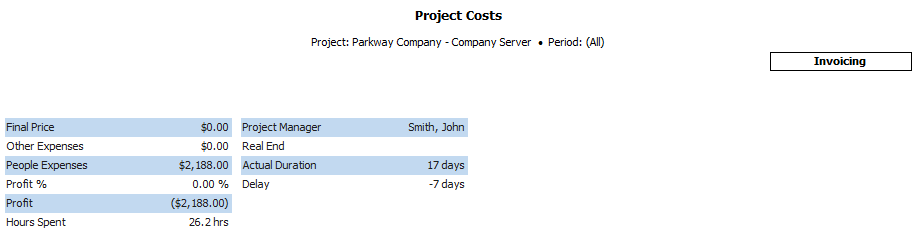
| Field | Description |
|---|---|
| Final Price | Actual Revenue from the project. |
| Other Expenses | Actual Other Costs from the project. |
| People Expenses | Actual People Costs from the project. |
| Profit % | Profit of the project in percent. |
| Profit | Profit of the project. |
| Hours Spent | The specific amount of hours worked on the project. |
| Project Manager | The project manager set up the project. |
| Real End | End Date of the project. |
| Actual Duration | Length of the project from its start to the end. |
| Delay | Number of days after the project's end. |
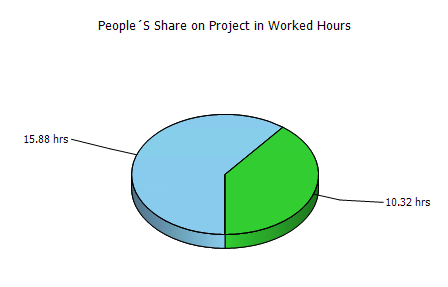
People's Share on Project in Worked Hours
The left pie chart shows the number of hours that your employees spent on a project.
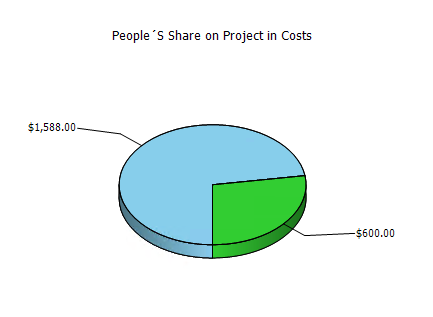
People's Share on Project in Costs
The right pie chart re-calculates these hours into costs that you have for each employee. These calculations are related to the set of salaries in the Salary module.
Work Report Trend in Individual Weeks
The line chart shows the progression of time sheet each week.
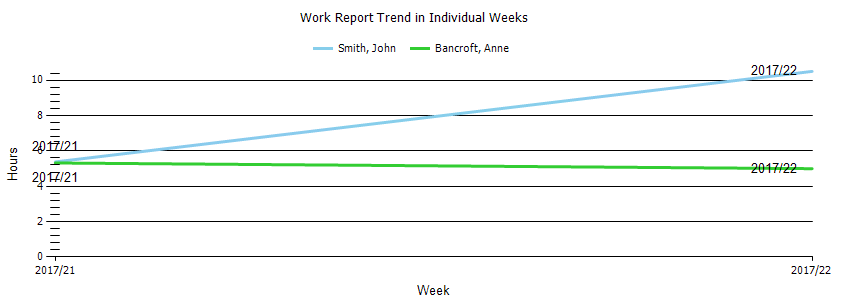
Table With Time Sheet Data
The table in the bottom part of the report represents the summary of all time sheet items that are related to a selected project - this is a detailed summary of all activities with time difficulty and precise description.
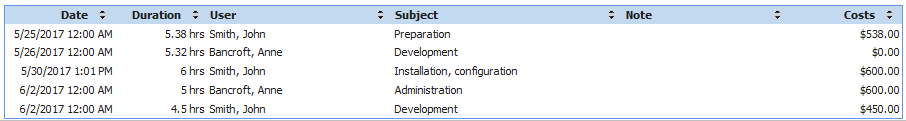
| Column | Description |
|---|---|
| Date | Date of the time sheet. |
| Duration | Length of the time sheet in hours. |
| User | Name of the user who worked on the project. |
| Subject | Type of activity that was done. |
| Note | Specific description of the work or other notes. |
| Costs | Costs that are related to the time sheet. These costs are calculated as a product of work Hours and Compensation that is in the Salary window. |
After generating a report, data are loaded in start-time order. You can sort items according to different columns. There are small arrows in the column headlines that are used for sorting rows - clicking the up or down arrow will sort items in the table in descending or ascending order.