eWay-CRM Sales Executive Dashboard
Description
eWay-CRM Sales Executive Dashboard is a PowerBI App that contains a set of predefined reports for your sales executives. You can download it for free and connect it to your eWay-CRM. The eWay-CRM Sales Executive Dashboard will then provide the most up-to-date data about your sales performance including the sales pipeline.
How to Install the App and Connect It With Your eWay-CRM
- Login to PowerBI.com (a PowerBI Pro license is required to use the application) and click PowerBI Apps.
- Search for the "eWay-CRM Sales Executive Dashboard" and install it.
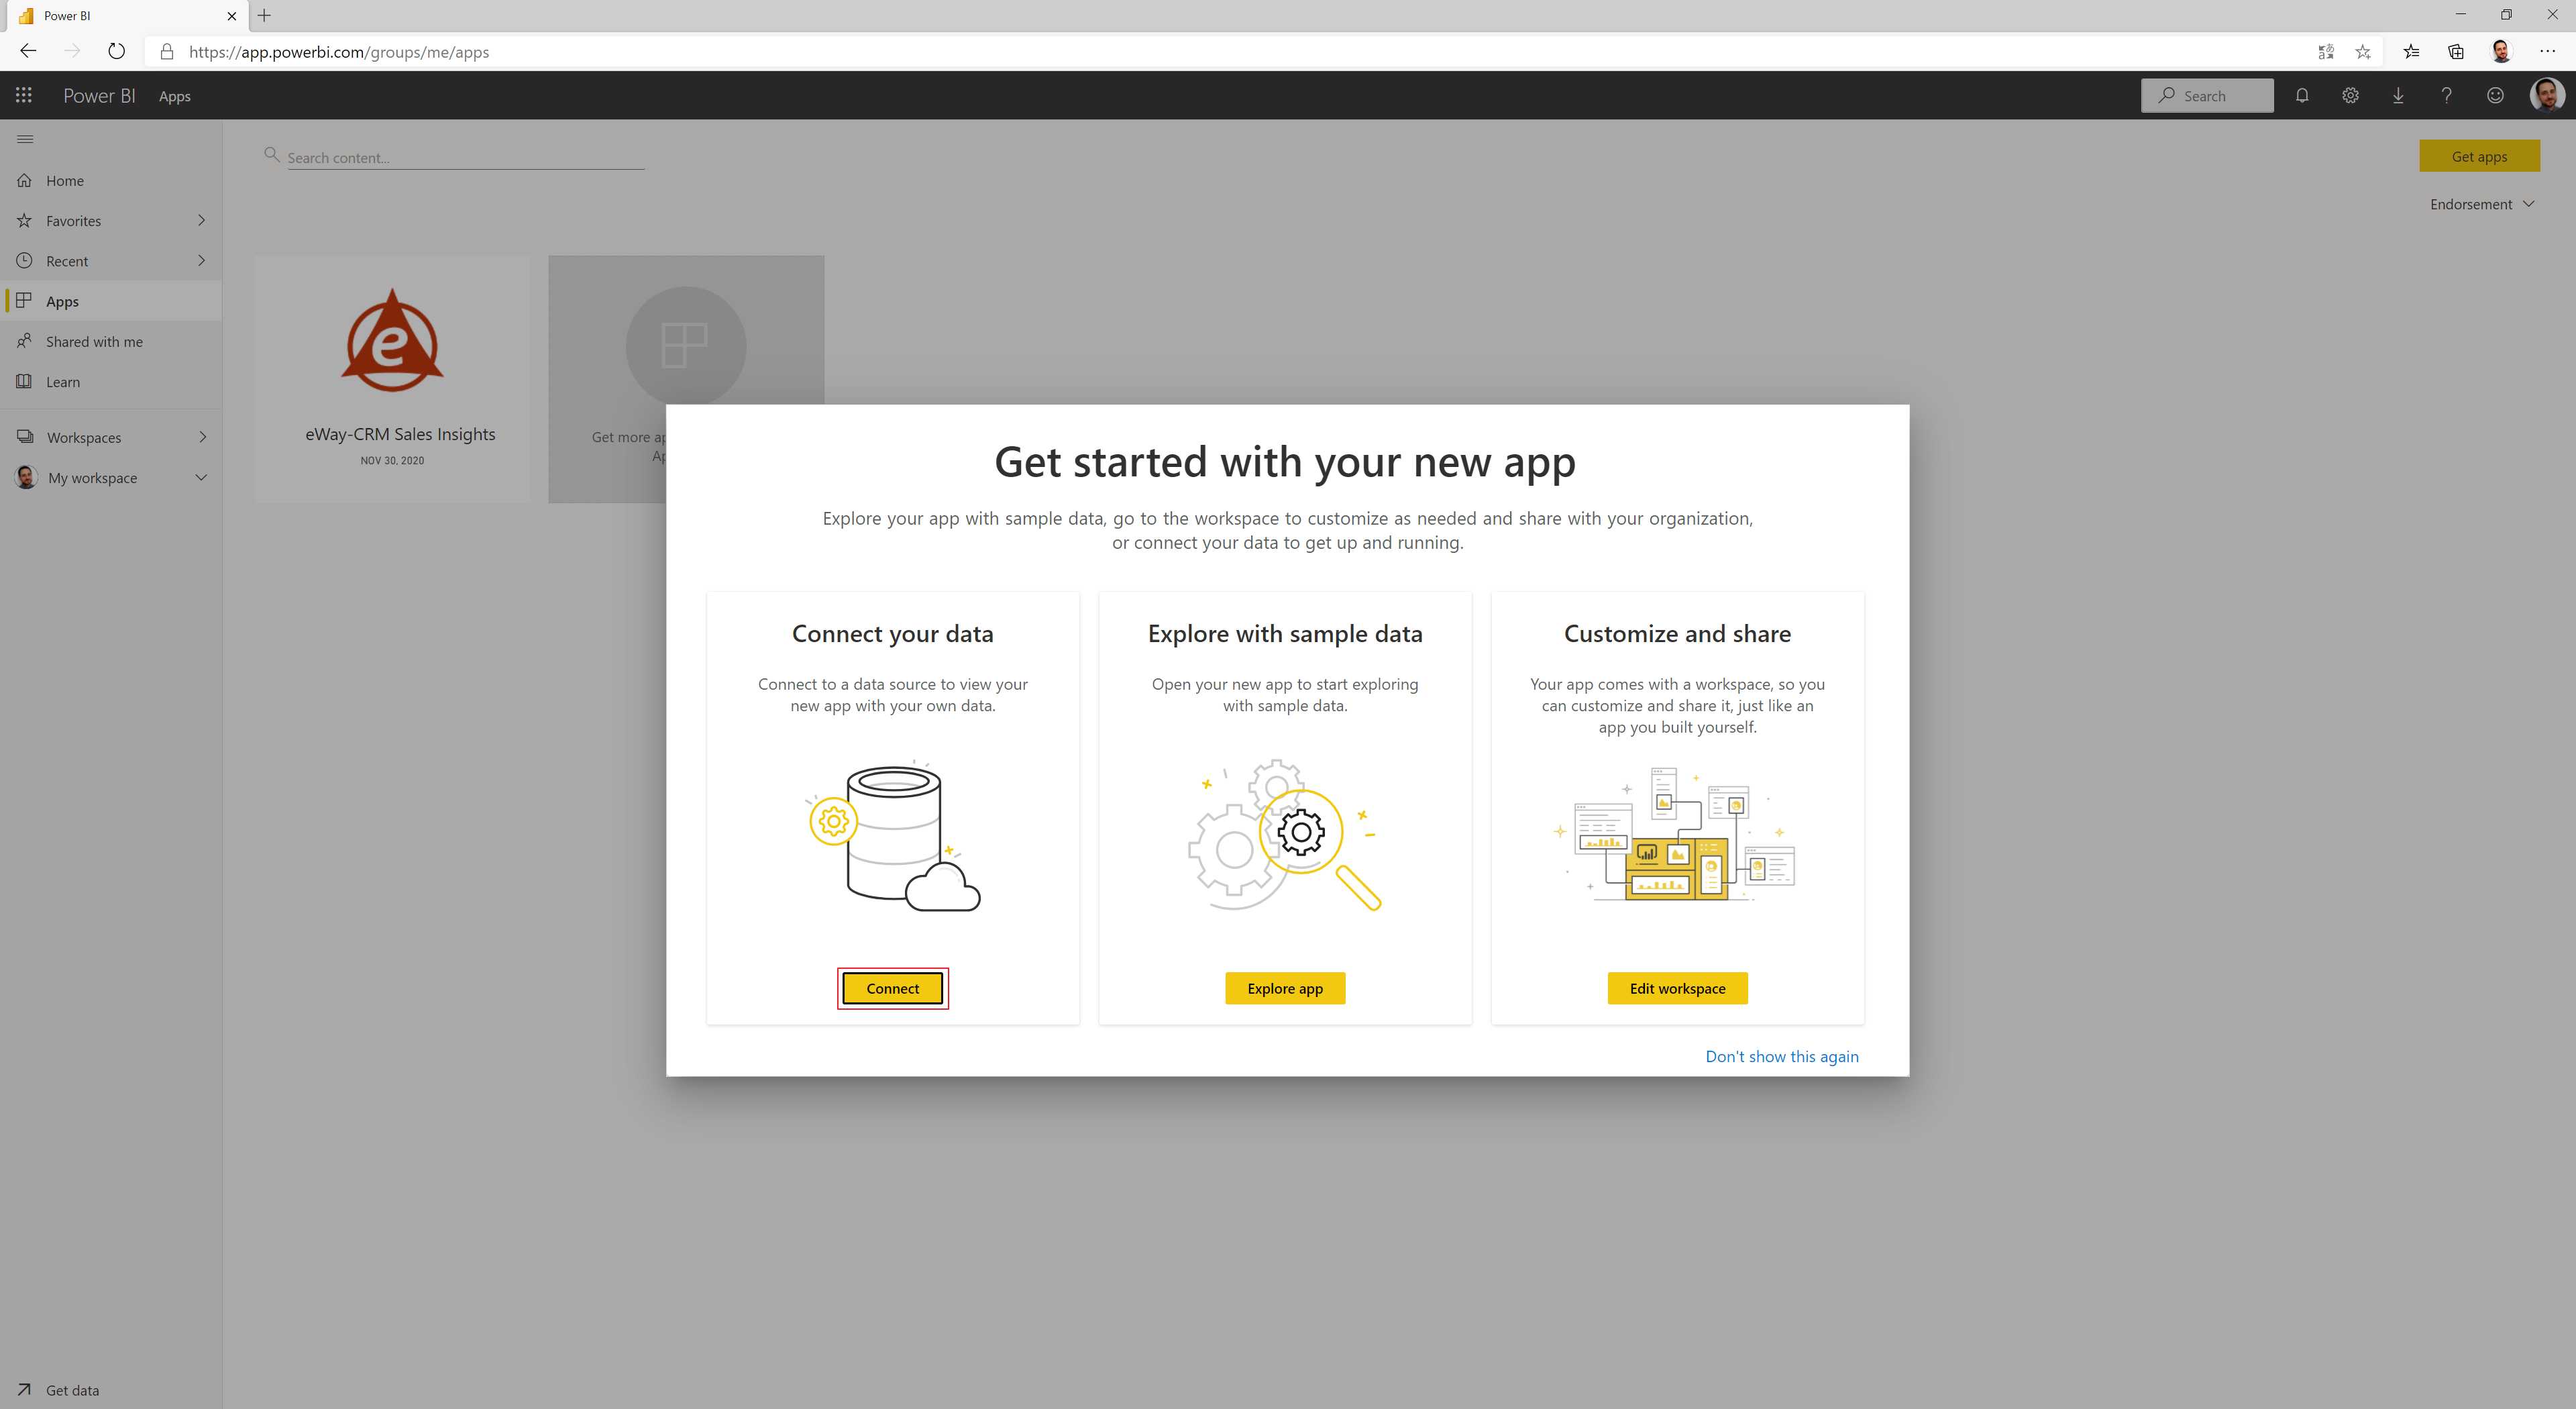
- Open the eWay-CRM Sales Insight app and select Connect your data.

- There is no need to insert any parameters, just click Next.

- Now, you have to log into your eWay-CRM account. Just select the OAuth2 method and click Sign In.

- In the first login dialog, you need to insert the address of your web service (same as you have in eWay-CRM Settings in your eWay-CRM Outlook).

- Then insert your username and password.

- If all credentials were inserted correctly, now, you can see the report on the basis of your eWay-CRM data.

Automatic Refresh
- Click the pencil icon in the top right part of your report.

- Then, move your mouse over the dataset and click the Schedule refresh icon.

- Here, you can set when the data will be automatically synchronized.

Sections
The report has these parts:

| Part | Description | Benefits |
| Header | The name of the report and the currency of the report. | |
| Revenue | The total revenue from all sales invoices and credit notes related to deals in the selected time period. | Have a basic overview of how much you invoiced on your deals. |
| New Deals | Deals created in the selected time period. | Know the number of all created deals and whether you are completing your goal. |
| Won Deals | Deals that were successfully completed in the selected time period. | Know the number of won deals and compare them to the number of created deals. |
| Selected Period | Select the time period what the report will be generated for. | Set the period you really want to report. |
| Sales Pipeline | The revenue of your deals by their statuses. | Get the information on what deals statuses accumulate the most money. |
| Sales Forecast | The revenue of your future deals by their statuses. | Look at the nearest months whether your deals are close to completion. Focus on the most reliable ones. |
| Sales Pipeline by Sales Reps | The revenue of your deals with statuses by your sales representatives. | Evaluate whether big deals are not stuck at their beginning. Who is responsible for it? |
| Top Sales Reps | The revenue by your sales representatives. | Find out who the best and the worst sales representative is. |
| Activities by Sales Reps | Activities made by your sales representatives. These activities are Journal types. | Evaluate the most active sales representatives and forms of communication they are using. |
| Top Referral Sources | The referral sources of your deals. | Determine what sources bring you the most deals and what needs to be improved. |
| Hot 10 Deals | Top 10 deals (sort by their value) to be closed within the selected period. | Focus on specific deals that are more profitable and their probability of success is higher. |
